- Home ›
- JFreeChartを使ったグラフ作成 ›
- タイトルの設定 ›
- HERE
タイトルの取得と設定(setTitle, getTitle)
広告
作成したタイトルをグラフに設定するにはJFreeChartクラスで用意されている「setTitle」メソッドを使います。
setTitle
public void setTitle(TextTitle title)
Sets the main title for the chart and sends a ChartChangeEvent to all
registered listeners. If you do not want a title for the chart, set it
to null. If you want more than one title on a chart, use the
addSubtitle(Title) method.

Parameters:
  title - the title (null permitted).
引数にはTextTitleクラスのオブジェクトを指定します。
例えば次のように記述します。
JFreeChart chart = ChartFactory.createPieChart(...);   # 引数は省略

TextTitle title = new TextTitle("タイトル");
chart.setTitle(title);
また単に文字列を指定してタイトルを設定する場合にはJFreeChartクラスで用意されている「setTitle」メソッドを使います。先ほどのメソッドと同じですが引数が異なります。
setTitle
public void setTitle(java.lang.String text)
Sets the chart title and sends a ChartChangeEvent to all registered
listeners. This is a convenience method that ends up calling the
setTitle(TextTitle) method. If there is an existing title, its text is
updated, otherwise a new title using the default font is added to the
chart. If text is null the chart title is set to null.

Parameters:
  text - the title text (null permitted).
引数にはタイトルに設定する文字列を指定します。このメソッドは引数に指定した文字列を使って内部的にTextTitleクラスのオブジェクトを作成し、デフォルトの設定を行った後でタイトルに設定します。
例えば次のように記述します。
JFreeChart chart = ChartFactory.createPieChart(...);   # 引数は省略

chart.setTitle("タイトル文字列");
タイトルの取得
現在グラフに設定されているタイトルを取得するにはJFreeChartクラスで用意されている「getTitle」メソッドを使います。
getTitle
public TextTitle getTitle()
Returns the main chart title. Very often a chart will have just one title,
so we make this case simple by providing accessor methods for the main
title. However, multiple titles are supported - see the addSubtitle(Title)
method.

Returns:
  The chart title (possibly null).
メソッドを実行すると、現在タイトルとして設定されているTextTitleクラスのオブジェクトを取得します。
例えば次のように記述します。
JFreeChart chart = ChartFactory.createPieChart(...);   # 引数は省略

TextTitle title = chart.getTitle();
既に設定してあるタイトルを取得し変更を加えたい場合に使用できます。
サンプルプログラム
では簡単なサンプルを作成して試してみます。
import org.jfree.chart.JFreeChart;
import org.jfree.chart.ChartFactory;
import org.jfree.data.general.DefaultPieDataset;
import javax.swing.JFrame;
import java.awt.BorderLayout;
import org.jfree.chart.ChartPanel;
public class Test2_1 extends JFrame{
public static void main(String[] args) {
Test2_1 frame = new Test2_1();
frame.setDefaultCloseOperation(JFrame.EXIT_ON_CLOSE);
frame.setBounds(10, 10, 500, 500);
frame.setTitle("グラフサンプル");
frame.setVisible(true);
}
Test2_1(){
JFreeChart chart =
ChartFactory.createPieChart("夏の旅行",
createData(),
true,
false,
false);
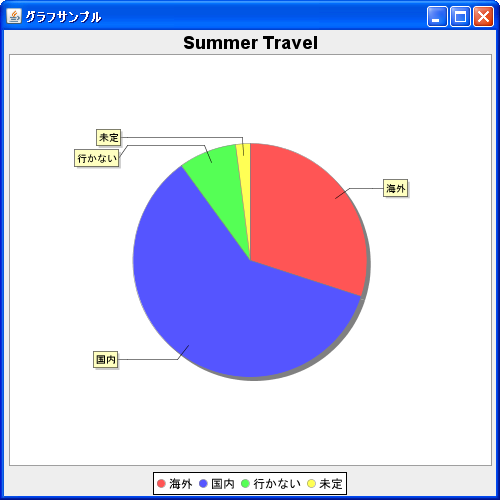
chart.setTitle("Summer Travel");
ChartPanel cpanel = new ChartPanel(chart);
getContentPane().add(cpanel, BorderLayout.CENTER);
}
private DefaultPieDataset createData(){
DefaultPieDataset data = new DefaultPieDataset();
data.setValue("海外", 30);
data.setValue("国内", 60);
data.setValue("行かない", 8);
data.setValue("未定", 2);
return data;
}
}
上記をコンパイルした後で実行すると次のようにJavaアプリケーションが起動します。
( Written by Tatsuo Ikura )