- Home ›
- JFreeChartを使ったグラフ作成 ›
- タイトルの設定 ›
- HERE
サブタイトルの追加する位置を指定
広告
サブタイトルは追加した順にグラフに追加されていきますが、追加したい位置を表すインデックスを指定してサブタイトルを追加することが可能です。
引数の異なる「addSubtitle」メソッドを使います。
addSubtitle
public void addSubtitle(int index,
                        Title subtitle)
Adds a subtitle at a particular position in the subtitle list, and sends
a ChartChangeEvent to all registered listeners.

Parameters:
  index - the index (in the range 0 to getSubtitleCount()).
  subtitle - the subtitle to add (null not permitted).
1番目の引数にサブタイトルを追加する位置を指定します。先頭に追加する場合は「0」を指定して下さい。2番目の引数にはTitleクラスのオブジェクトを指定します。
注意すべき点は凡例もサブタイトルの1つとして扱われることです。凡例がいつ追加されたのかに注意して下さい。デフォルトで凡例を表示する設定にしている場合はサブタイトルの先頭は凡例の場合もあります。
例えば次のように記述します。
JFreeChart chart = ChartFactory.createPieChart(...);   # 引数は省略

TextTitle title = new TextTitle("タイトル");
chart.setTitle(title);

TextTitle subtitle1 = new TextTitle("サブタイトル1");
chart.addSubtitle(subtitle1);
TextTitle subtitle2 = new TextTitle("サブタイトル2");
chart.addSubtitle(subtitle1);
TextTitle subtitle3 = new TextTitle("サブタイトル3");
chart.addSubtitle(1, subtitle3);
上記の場合は太さが2ピクセルの枠線を設定します。
サンプルプログラム
では簡単なサンプルを作成して試してみます。
import org.jfree.chart.JFreeChart;
import org.jfree.chart.ChartFactory;
import org.jfree.data.general.DefaultPieDataset;
import javax.swing.JFrame;
import java.awt.BorderLayout;
import org.jfree.chart.ChartPanel;
import org.jfree.chart.title.TextTitle;
import java.awt.Font;
import java.awt.Color;
import org.jfree.ui.RectangleEdge;
public class Test16_1 extends JFrame{
public static void main(String[] args) {
Test16_1 frame = new Test16_1();
frame.setDefaultCloseOperation(JFrame.EXIT_ON_CLOSE);
frame.setBounds(10, 10, 500, 500);
frame.setTitle("グラフサンプル");
frame.setVisible(true);
}
Test16_1(){
JFreeChart chart =
ChartFactory.createPieChart("",
createData(),
true,
false,
false);
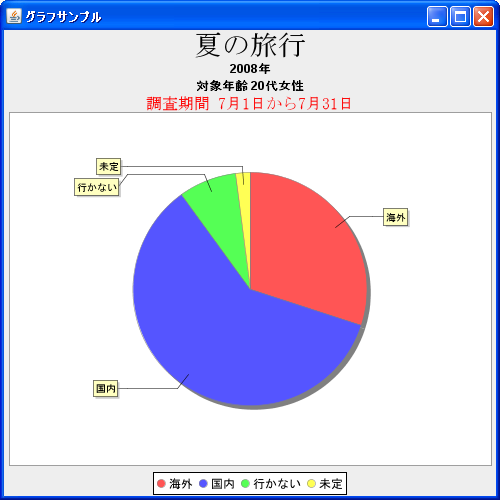
TextTitle title = new TextTitle("夏の旅行");
title.setFont(new Font("MS 明朝", Font.PLAIN, 28));
chart.setTitle(title);
TextTitle subtitle1 = new TextTitle("2008年");
chart.addSubtitle(subtitle1);
TextTitle subtitle2 = new TextTitle("調査期間 7月1日から7月31日");
subtitle2.setFont(new Font("MS 明朝", Font.PLAIN, 16));
subtitle2.setPaint(Color.RED);
chart.addSubtitle(subtitle2);
TextTitle subtitle3 = new TextTitle("対象年齢 20代女性");
chart.addSubtitle(2, subtitle3);
ChartPanel cpanel = new ChartPanel(chart);
getContentPane().add(cpanel, BorderLayout.CENTER);
}
private DefaultPieDataset createData(){
DefaultPieDataset data = new DefaultPieDataset();
data.setValue("海外", 30);
data.setValue("国内", 60);
data.setValue("行かない", 8);
data.setValue("未定", 2);
return data;
}
}
上記をコンパイルした後で実行すると次のようにJavaアプリケーションが起動します。
( Written by Tatsuo Ikura )