- Home ›
- JFreeChartを使ったグラフ作成 ›
- タイトルの設定 ›
- HERE
TextTitleクラス
広告
JFreeChartでタイトルを取り扱うためにTextTitleクラスが用意されています。
TextTitleクラスのクラス図は次のようになっています。
- java.lang.Object
- org.jfree.chart.block.AbstractBlock
- org.jfree.chart.title.Title
- org.jfree.chart.title.TextTitle
- public class TextTitle extends Title implements java.io.Serializable, java.lang.Cloneable, org.jfree.util.PublicCloneable
用意されているコンストラクタは次の4つです。
| コンストラクタ |
|---|
| TextTitle() Creates a new title, using default attributes where necessary. |
| TextTitle(java.lang.String text) Creates a new title, using default attributes where necessary. |
| TextTitle(java.lang.String text, java.awt.Font font) Creates a new title, using default attributes where necessary. |
| TextTitle(java.lang.String text, java.awt.Font font, java.awt.Paint paint, org.jfree.ui.RectangleEdge position, org.jfree.ui.HorizontalAlignment horizontalAlignment, org.jfree.ui.VerticalAlignment verticalAlignment, org.jfree.ui.RectangleInsets padding) Creates a new title. |
TextTitleクラスでは表示する文字列の他にフォントの指定や背景の設定、位置関係などが指定可能となっています。ここでは基本となる2番目のコンストラクタを見てみます。
1番目のコンストラクタは系列の名前だけを指定します。このコンストラクタの場合、時間の単位はデフォルトの値である「日」になります。通常は系列の名前と時間の単位を指定する2番目のコンストラクタを使用します。
TextTitle
public TextTitle(java.lang.String text)
Creates a new title, using default attributes where necessary.

Parameters:
  text - the title text (null not permitted).
引数にタイトルとして表示する文字列を指定します。
例えば次のように記述します。
TextTitle title = new TextTitle("タイトル");
これでTextTitleクラスのオブジェクトが作成できました。このオブジェクトに対して用意されたメソッドを使い設定を行っていきます。
サンプルプログラム
では簡単なサンプルを作成して試してみます。
import org.jfree.chart.JFreeChart;
import org.jfree.chart.ChartFactory;
import org.jfree.data.general.DefaultPieDataset;
import javax.swing.JFrame;
import java.awt.BorderLayout;
import org.jfree.chart.ChartPanel;
import org.jfree.chart.title.TextTitle;
public class Test1_1 extends JFrame{
public static void main(String[] args) {
Test1_1 frame = new Test1_1();
frame.setDefaultCloseOperation(JFrame.EXIT_ON_CLOSE);
frame.setBounds(10, 10, 500, 500);
frame.setTitle("グラフサンプル");
frame.setVisible(true);
}
Test1_1(){
JFreeChart chart =
ChartFactory.createPieChart("夏の旅行",
createData(),
true,
false,
false);
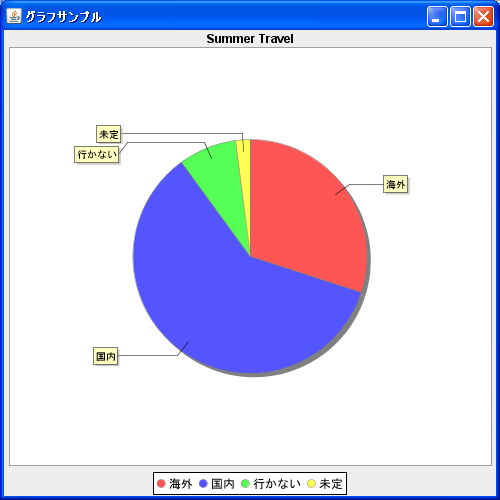
TextTitle title = new TextTitle("Summer Travel");
chart.setTitle(title);
ChartPanel cpanel = new ChartPanel(chart);
getContentPane().add(cpanel, BorderLayout.CENTER);
}
private DefaultPieDataset createData(){
DefaultPieDataset data = new DefaultPieDataset();
data.setValue("海外", 30);
data.setValue("国内", 60);
data.setValue("行かない", 8);
data.setValue("未定", 2);
return data;
}
}
上記をコンパイルした後で実行すると次のようにJavaアプリケーションが起動します。
( Written by Tatsuo Ikura )