- Home ›
- JFreeChartを使ったグラフ作成 ›
- 時系列グラフ(TimeSeriesChart) ›
- HERE
時系列グラフの作成(createTimeSeriesChartメソッド)
広告
時系列グラフの基本的な作成方法を確認します。
まずChartFactoryクラスの「createTimeSeriesChart」メソッドを使って時系列グラフを扱うJFreeChartクラスのオブジェクトを作成します。
createTimeSeriesChart
public static JFreeChart createTimeSeriesChart(java.lang.String title,
                                               java.lang.String timeAxisLabel,
                                               java.lang.String valueAxisLabel,
                                               XYDataset dataset,
                                               boolean legend,
                                               boolean tooltips,
                                               boolean urls)
Creates and returns a time series chart. A time series chart is an XYPlot
with a DateAxis for the x-axis and a NumberAxis for the y-axis. The
default renderer is an XYLineAndShapeRenderer.

A convenient dataset to use with this chart is a TimeSeriesCollection.

Parameters:
  title - the chart title (null permitted).
  timeAxisLabel - a label for the time axis (null permitted).
  valueAxisLabel - a label for the value axis (null permitted).
  dataset - the dataset for the chart (null permitted).
  legend - a flag specifying whether or not a legend is required.
  tooltips - configure chart to generate tool tips?
  urls - configure chart to generate URLs?
Returns:
  A time series chart.
1番目の引数にグラフのタイトルを文字列で指定します。
2番目の引数には時間軸のラベルを文字列で指定します。3番目の引数には値が配置される軸のラベルを文字列で指定します。
4番目の引数にはグラフのデータをXYDatasetインターフェースを実装したクラスのオブジェクトで指定します。今回はTimeSeriesCollectionクラスを使います。詳細は次のページで確認します。
5番目の引数には凡例を表示するかどうかを「true」か「false」で指定します。
6番目の引数にはツールチップを作成するかどうかを「true」か「false」で指定します。
7番目の引数にはURLを作成するかどうかを「true」か「false」で指定します。
実際の使い方は次のようになります。
TimeSeriesCollection data = new TimeSeriesCollection();
JFreeChart chart = ChartFactory.createTimeSeriesChart("PV推移",
                                                "月",
                                                "PV",
                                                data,
                                                true,
                                                false,
                                                false);
実際のデータの追加方法は次のページで確認します。
サンプルプログラム
では簡単なサンプルを作成して試してみます。
import org.jfree.chart.JFreeChart;
import org.jfree.chart.ChartFactory;
import org.jfree.data.time.TimeSeriesCollection;

import javax.swing.JFrame;
import java.awt.BorderLayout;
import org.jfree.chart.ChartPanel;

public class Test1_1 extends JFrame{
  public static void main(String[] args) {
    Test1_1 frame = new Test1_1();

    frame.setDefaultCloseOperation(JFrame.EXIT_ON_CLOSE);
    frame.setBounds(10, 10, 500, 500);
    frame.setTitle("グラフサンプル");
    frame.setVisible(true);
  }

  Test1_1(){
    TimeSeriesCollection data = new TimeSeriesCollection();
    JFreeChart chart =
      ChartFactory.createTimeSeriesChart("PV推移",
                                  "月",
                                  "PV",
                                  data,
                                  true,
                                  false,
                                  false);

    ChartPanel cpanel = new ChartPanel(chart);
    getContentPane().add(cpanel, BorderLayout.CENTER);
  }
}
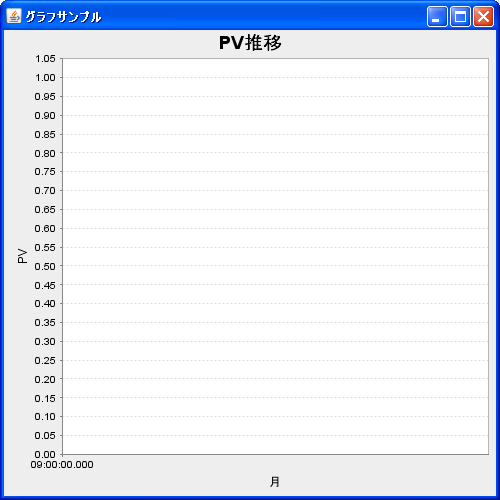
上記をコンパイルした後で実行すると次のようにJavaアプリケーションが起動します。
( Written by Tatsuo Ikura )