- Home ›
- JFreeChartを使ったグラフ作成 ›
- 散布図(ScatterPlot) ›
- HERE
散布図の描画領域(XYPlotクラス)
広告
グラフの描画領域を取得し、描画領域に対する設定を行っていきます。ファクトリメソッドを使ってJFreeChartクラスのオブジェクトを作成した場合は、JFreeChartクラスで用意されている「getPlot」メソッドを使ってPlotクラスのオブジェクトを取得します。
散布図の場合には、取得したPlotクラスのオブジェクトを、PlotクラスのサブクラスであるXYPlotクラスにキャストして取得して使います。時系列グラフの場合と同じですので、詳しくは「時系列グラフの描画領域(XYPlotクラス)」を参照して下さい。
例えば次のように記述します。
JFreeChart chart = ChartFactory.createScatterPlot(...);      /* 引数は省略 */

XYPlot plot = (XYPlot)chart.getPlot();
サンプルプログラム
では簡単なサンプルを作成して試してみます。
import org.jfree.chart.JFreeChart;
import org.jfree.chart.ChartFactory;
import org.jfree.data.xy.XYSeriesCollection;
import org.jfree.chart.plot.PlotOrientation;
import org.jfree.data.xy.XYSeries;

import javax.swing.JFrame;
import java.awt.BorderLayout;
import org.jfree.chart.ChartPanel;

import org.jfree.chart.plot.XYPlot;
import java.awt.Color;

public class Test5_1 extends JFrame{
  public static void main(String[] args) {
    Test5_1 frame = new Test5_1();

    frame.setDefaultCloseOperation(JFrame.EXIT_ON_CLOSE);
    frame.setBounds(10, 10, 500, 500);
    frame.setTitle("グラフサンプル");
    frame.setVisible(true);
  }

  Test5_1(){
    JFreeChart chart =
      ChartFactory.createScatterPlot("来店者傾向",
                                     "気温",
                                     "人数",
                                     createData(),
                                     PlotOrientation.VERTICAL,
                                     true,
                                     false,
                                     false);

    XYPlot plot = (XYPlot)chart.getPlot();
    plot.setBackgroundPaint(Color.ORANGE);

    ChartPanel cpanel = new ChartPanel(chart);
    getContentPane().add(cpanel, BorderLayout.CENTER);
  }

  private XYSeriesCollection createData(){
    XYSeriesCollection data = new XYSeriesCollection();

    int xdata1[] = {10, 15, 20, 22, 24, 26,  4,  8, 28, 30, 25, 12, 33};
    int ydata1[] = {26, 42, 54, 56, 52, 58, 20, 24, 51, 49, 54, 38, 44};

    int xdata2[] = {29, 14, 12, 20, 28, 35, 32, 31, 25};
    int ydata2[] = {52,  7,  6,  5, 56, 64, 58, 62, 30};

    XYSeries series1 = new XYSeries("動物園");

    for (int i = 0 ; i < 13 ; i++){
      series1.add(xdata1[i], ydata1[i]);
    }

    XYSeries series2 = new XYSeries("アイスクリーム屋");

    for (int i = 0 ; i < 9 ; i++){
      series2.add(xdata2[i], ydata2[i]);
    }

    data.addSeries(series1);
    data.addSeries(series2);

    return data;
  }
}
上記をコンパイルした後で実行すると次のようにJavaアプリケーションが起動します。
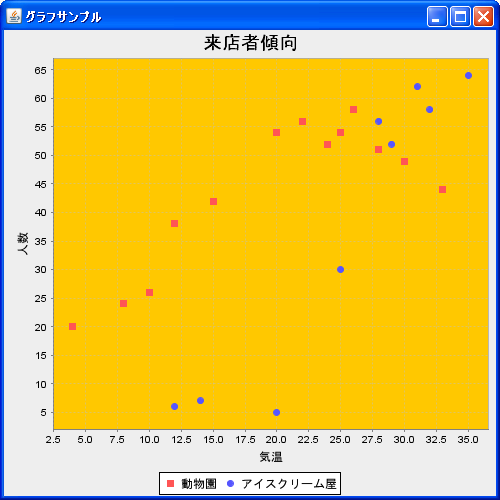
今回は例として描画領域の背景色をオレンジに変更しました。また上記のオレンジの箇所がグラフの描画領域となります。
( Written by Tatsuo Ikura )