- Home ›
- JFreeChartを使ったグラフ作成 ›
- 散布図(ScatterPlot) ›
- HERE
散布図のデータ(XYSeriesCollectionクラス)
散布図では系列を作成し個々のデータを系列に登録していきます。そして全ての系列を系列コレクションに追加します。
まずは系列コレクションを表すXYSeriesCollectionクラスのオブジェクトを作成します。
XYSeriesCollectionクラスのクラス図は次のようになっています。
- java.lang.Object
- org.jfree.data.general.AbstractDataset
- org.jfree.data.general.AbstractSeriesDataset
- org.jfree.data.xy.AbstractXYDataset
- org.jfree.data.xy.AbstractIntervalXYDataset
- org.jfree.data.xy.XYSeriesCollection
- public class XYSeriesCollection extends AbstractIntervalXYDataset implements IntervalXYDataset, DomainInfo, org.jfree.util.PublicCloneable, java.io.Serializable
コンストラクタは2つ用意されています。デフォルトのコンストラクタは次のようになっています。
XYSeriesCollection
public XYSeriesCollection()
Constructs an empty dataset.
次のようにオブジェクトを作成します。
XYSeriesCollection data = new XYSeriesCollection();
系列の登録
系列はXYSeriesクラスを使用します。クラス図は次のようになっています。
- java.lang.Object
- org.jfree.data.general.Series
- org.jfree.data.xy.XYSeries
- public class XYSeries extends Series implements java.lang.Cloneable, java.io.Serializable
XYSeriesクラスのコンストラクタは3つ用意されています。系列名だけを指定するコンストラクタについて見てみます。
XYSeries
public XYSeries(java.lang.Comparable key)
Creates a new empty series. By default, items added to the series will
be sorted into ascending order by x-value, and duplicate x-values will
be allowed (these defaults can be modified with another constructor.

Parameters:
  key - the series key (null not permitted).
引数には系列の名前を指定します。
XYSeriesクラスのオブジェクトを作成したらXYSeriesCollectionクラスで用意されている「addSeries」メソッドを使って系列を追加していきます。
addSeries
public void addSeries(XYSeries series)
Adds a series to the collection and sends a DatasetChangeEvent  to all
registered listeners.

Parameters:
  series - the series (null not permitted).
引数には系列を表す「XYSeries」クラスのオブジェクトを指定します。
実際には次のように記述します。
XYSeriesCollection data = new XYSeriesCollection();

XYSeries series = new XYSeries("動物園");
data.addSeries(series);
これで系列が出来ました。最後に系列毎にデータを登録していきます。
データの登録
系列にデータを登録するにはXYSeriesクラスで用意されている「add」メソッドを使います。
add
public void add(java.lang.Number x,
                java.lang.Number y)
Adds new data to the series and sends a SeriesChangeEvent to all
registered listeners.

Throws an exception if the x-value is a duplicate AND the
allowDuplicateXValues flag is false.

Parameters:
  x - the x-value (null not permitted).
  y - the y-value (null permitted).
1番目の引数と2番目の引数にデータ毎のX軸とY軸の値を指定します。
今回は次のようなデータを元にグラフを作成します。
| X軸 | Y軸 |
|---|---|
| 10 | 26 |
| 15 | 42 |
| 20 | 54 |
| 22 | 56 |
| 24 | 52 |
| 26 | 58 |
| 4 | 20 |
| 8 | 24 |
| 28 | 51 |
| 30 | 49 |
| 25 | 54 |
| 12 | 38 |
| 33 | 44 |
実際には次のように記述します。
XYSeriesCollection data = new XYSeriesCollection();

XYSeries series = new XYSeries("動物園");
series.add(10, 26);
series.add(15, 42);
series.add(20, 54);
/* データの数だけ実行 */

data.addSeries(series);
サンプルプログラム
では簡単なサンプルを作成して試してみます。
import org.jfree.chart.JFreeChart;
import org.jfree.chart.ChartFactory;
import org.jfree.data.xy.XYSeriesCollection;
import org.jfree.chart.plot.PlotOrientation;

import org.jfree.data.xy.XYSeries;

import javax.swing.JFrame;
import java.awt.BorderLayout;
import org.jfree.chart.ChartPanel;

public class Test2_1 extends JFrame{
  public static void main(String[] args) {
    Test2_1 frame = new Test2_1();

    frame.setDefaultCloseOperation(JFrame.EXIT_ON_CLOSE);
    frame.setBounds(10, 10, 500, 500);
    frame.setTitle("グラフサンプル");
    frame.setVisible(true);
  }

  Test2_1(){
    JFreeChart chart =
      ChartFactory.createScatterPlot("来店者傾向",
                                     "気温",
                                     "人数",
                                     createData(),
                                     PlotOrientation.VERTICAL,
                                     true,
                                     false,
                                     false);

    ChartPanel cpanel = new ChartPanel(chart);
    getContentPane().add(cpanel, BorderLayout.CENTER);
  }

  private XYSeriesCollection createData(){
    XYSeriesCollection data = new XYSeriesCollection();

    int xdata[] = {10, 15, 20, 22, 24, 26,  4,  8, 28, 30, 25, 12, 33};
    int ydata[] = {26, 42, 54, 56, 52, 58, 20, 24, 51, 49, 54, 38, 44};

    XYSeries series = new XYSeries("動物園");

    for (int i = 0 ; i < 13 ; i++){
      series.add(xdata[i], ydata[i]);
    }

    data.addSeries(series);

    return data;
  }
}
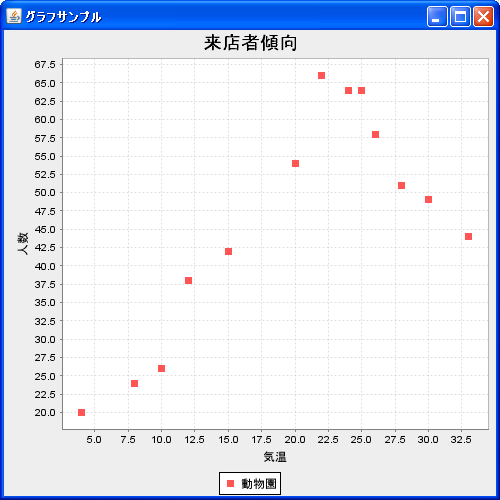
上記をコンパイルした後で実行すると次のようにJavaアプリケーションが起動します。
( Written by Tatsuo Ikura )