- Home ›
- JFreeChartを使ったグラフ作成 ›
- 散布図(ScatterPlot) ›
- HERE
散布図の作成(createScatterPlotメソッド)
散布図の基本的な作成方法を確認します。
まずChartFactoryクラスの「createScatterPlot」メソッドを使って散布図を扱うJFreeChartクラスのオブジェクトを作成します。
createScatterPlot
public static JFreeChart createScatterPlot(java.lang.String title,
                                           java.lang.String xAxisLabel,
                                           java.lang.String yAxisLabel,
                                           XYDataset dataset,
                                           PlotOrientation orientation,
                                           boolean legend,
                                           boolean tooltips,
                                           boolean urls)
Creates a scatter plot with default settings. The chart object returned
by this method uses an XYPlot instance as the plot, with a NumberAxis for
the domain axis, a NumberAxis as the range axis, and an
XYLineAndShapeRenderer as the renderer.

Parameters:
  title - the chart title (null permitted).
  xAxisLabel - a label for the X-axis (null permitted).
  yAxisLabel - a label for the Y-axis (null permitted).
  dataset - the dataset for the chart (null permitted).
  orientation - the plot orientation (horizontal or vertical) (null NOT
    permitted).
  legend - a flag specifying whether or not a legend is required.
  tooltips - configure chart to generate tool tips?
  urls - configure chart to generate URLs?
Returns:
  A scatter plot.
1番目の引数にグラフのタイトルを文字列で指定します。
2番目の引数にはX軸のラベルを文字列で指定します。3番目の引数にはY軸のラベルを文字列で指定します。
4番目の引数にはグラフのデータをXYDatasetインターフェースを実装したクラスのオブジェクトで指定します。今回はXYSeriesCollectionクラスを使います。詳細は次のページで確認します。
5番目の引数には棒グラフの向きを指定します。指定可能な値はorg.jfree.chart.plot.PlotOrientationクラスで定義されており、次のどちらかとなります。
PlotOrientation.VERTICAL    値を表す軸がY軸
PlotOrientation.HORIZONTAL  値を表す軸がX軸
6番目の引数には凡例を表示するかどうかを「true」か「false」で指定します。
7番目の引数にはツールチップを作成するかどうかを「true」か「false」で指定します。
8番目の引数にはURLを作成するかどうかを「true」か「false」で指定します。
実際の使い方は次のようになります。
XYSeriesCollection data = new XYSeriesCollection();
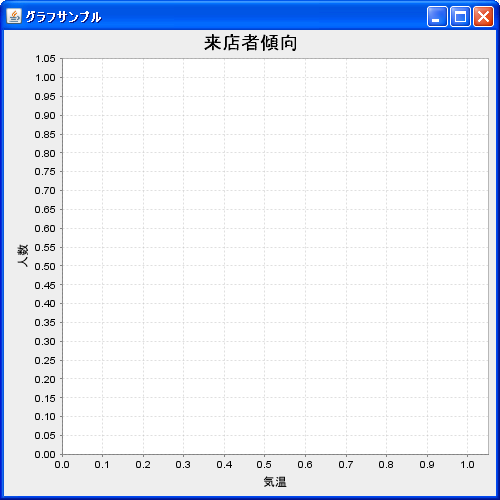
JFreeChart chart = ChartFactory.createScatterPlot("来店者傾向",
"気温",
"人数",
data,
PlotOrientation.VERTICAL,
true,
false,
false);
実際のデータの追加方法は次のページで確認します。
サンプルプログラム
では簡単なサンプルを作成して試してみます。
import org.jfree.chart.JFreeChart;
import org.jfree.chart.ChartFactory;
import org.jfree.data.xy.XYSeriesCollection;
import org.jfree.chart.plot.PlotOrientation;

import javax.swing.JFrame;
import java.awt.BorderLayout;
import org.jfree.chart.ChartPanel;

public class Test1_1 extends JFrame{
  public static void main(String[] args) {
    Test1_1 frame = new Test1_1();

    frame.setDefaultCloseOperation(JFrame.EXIT_ON_CLOSE);
    frame.setBounds(10, 10, 500, 500);
    frame.setTitle("グラフサンプル");
    frame.setVisible(true);
  }

  Test1_1(){
    XYSeriesCollection data = new XYSeriesCollection();
    JFreeChart chart =
      ChartFactory.createScatterPlot("来店者傾向",
                                     "気温",
                                     "人数",
                                     data,
                                     PlotOrientation.VERTICAL,
                                     true,
                                     false,
                                     false);

    ChartPanel cpanel = new ChartPanel(chart);
    getContentPane().add(cpanel, BorderLayout.CENTER);
  }
}
上記をコンパイルした後で実行すると次のようにJavaアプリケーションが起動します。
( Written by Tatsuo Ikura )