- Home ›
- JFreeChartを使ったグラフ作成 ›
- ドーナッツグラフ(RingChart) ›
- HERE
ドーナッツグラフの描画領域(RingPlotクラス)
グラフの描画領域を取得し、描画領域に対する設定を行っていきます。ファクトリメソッドを使ってJFreeChartクラスのオブジェクトを作成した場合は、JFreeChartクラスで用意されている「getPlot」メソッドを使ってPlotクラスのオブジェクトを取得します。
getPlot
public Plot getPlot()
Returns the plot for the chart. The plot is a class responsible for
coordinating the visual representation of the data, including the
axes (if any).

Returns:
  The plot.
ドーナッツグラフの場合には、取得したPlotクラスのオブジェクトを、PlotクラスのサブクラスであるRingPlotクラスにキャストして取得して使います。例えば次のように記述します。
JFreeChart chart = ChartFactory.createRingChart(...);      /* 引数は省略 */

RingPlot plot = (RingPlot)chart.getPlot();
ではRingPlotクラスについて確認します。
RingPlotクラス
RingPlotクラスのクラス図は次のようになっています。
- java.lang.Object
- org.jfree.chart.plot.Plot
- org.jfree.chart.plot.PiePlot
- org.jfree.chart.plot.RingPlot
- public class RingPlot extends PiePlot implements java.lang.Cloneable, java.io.Serializable
RingPlotクラスは円グラフの描画領域を表すPiePlotクラスのサブクラスとなっています。
用意されているコンストラクタは次の2つです。
| コンストラクタ |
|---|
| RingPlot() Creates a new plot with a null dataset. |
| RingPlot(PieDataset dataset) Creates a new plot for the specified dataset. |
今回はコンストラクタでオブジェクトを直接生成するのではなく、JFreeChartクラスの「getPlot」メソッドでオブジェクトを取得します。
取得したRingPlotクラスのオブジェクトはドーナッツグラフの描画領域を表すオブジェクトです。RingPlotクラスで定義されているメソッドや、親クラスのPlotクラスで用意されているメソッドを使用して描画領域に対する設定を行うことが可能です。
サンプルプログラム
では簡単なサンプルを作成して試してみます。
import org.jfree.chart.JFreeChart;
import org.jfree.chart.ChartFactory;
import org.jfree.data.general.DefaultPieDataset;

import javax.swing.JFrame;
import java.awt.BorderLayout;
import org.jfree.chart.ChartPanel;

import org.jfree.chart.plot.RingPlot;
import java.awt.Color;

public class Test3_1 extends JFrame{
  public static void main(String[] args) {
    Test3_1 frame = new Test3_1();

    frame.setDefaultCloseOperation(JFrame.EXIT_ON_CLOSE);
    frame.setBounds(10, 10, 500, 500);
    frame.setTitle("グラフサンプル");
    frame.setVisible(true);
  }

  Test3_1(){

    JFreeChart chart =
      ChartFactory.createRingChart("夏の旅行",
                                   createData(),
                                   true,
                                   false,
                                   false);

    RingPlot plot = (RingPlot)chart.getPlot();
    plot.setBackgroundPaint(Color.ORANGE);

    ChartPanel cpanel = new ChartPanel(chart);
    getContentPane().add(cpanel, BorderLayout.CENTER);
  }

  private DefaultPieDataset createData(){
    DefaultPieDataset data = new DefaultPieDataset();
    data.setValue("北海道", 35);
    data.setValue("沖縄", 28);
    data.setValue("京都", 17);
    data.setValue("大阪", 5);
    data.setValue("その他", 15);

    return data;
  }
}
上記をコンパイルした後で実行すると次のようにJavaアプリケーションが起動します。
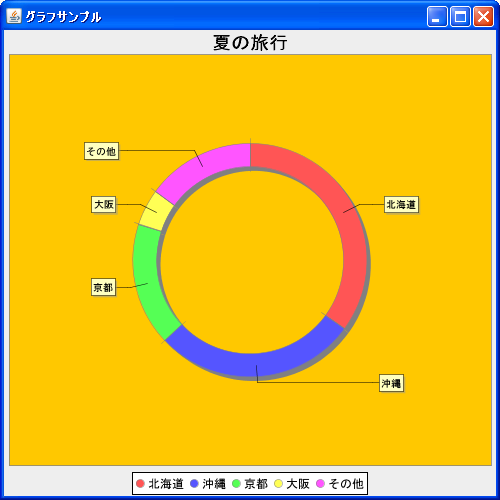
今回は例として描画領域の背景色をオレンジに変更しました。また上記のオレンジの箇所がグラフの描画領域となります。
( Written by Tatsuo Ikura )