- Home ›
- JFreeChartを使ったグラフ作成 ›
- 描画領域の設定 ›
- HERE
輪郭の色の指定(setOutlinePaint)
広告
輪郭を表示する設定にしたいる場合に輪郭の色などを設定する方法を確認します。Plotクラスで用意されている「setOutlinePaint」メソッドを使います。
setOutlinePaint
public void setOutlinePaint(java.awt.Paint paint)
Sets the paint used to draw the outline of the plot area and sends a
PlotChangeEvent to all registered listeners. If you set this attribute
to null, no outline will be drawn.

Parameters:
  paint - the paint (null permitted).
引数にはPaintインターフェースを実装したクラスのオブジェクトを指定します。
Paintインターフェースを実装したクラスとしては次のようなものがあります。(詳細は「色属性の設定」などを参照して下さい)。
Color                  単純色
GradientPaint          線形グラデーションパターン
TexturePaint           テクスチャーによる塗りつぶし
LinearGradientPaint    線形グラデーションパターン
RadialGradientPaint    円放射状グラデーションパターン
グラデーションやテクスチャーなども利用できますが、枠線ですので今回は単に色を指定してみます。色指定の場合は「java.awt.Color」クラスのオブジェクトを使います。(Colorクラスについては「Colorクラス」を参照して下さい)。
例えば次のように記述します。
JFreeChart chart = ChartFactory.createPieChart(...);      /* 引数は省略 */

Plot plot = chart.getPlot();
plot.setOutlinePaint(Color.PINK);
サンプルプログラム
では簡単なサンプルを作成して試してみます。
import org.jfree.chart.JFreeChart;
import org.jfree.chart.ChartFactory;
import org.jfree.data.category.DefaultCategoryDataset;
import org.jfree.chart.plot.PlotOrientation;

import javax.swing.JFrame;
import java.awt.BorderLayout;
import org.jfree.chart.ChartPanel;

import org.jfree.chart.plot.Plot;
import java.awt.Color;

public class Test3_1 extends JFrame{
  public static void main(String[] args) {
    Test3_1 frame = new Test3_1();

    frame.setDefaultCloseOperation(JFrame.EXIT_ON_CLOSE);
    frame.setBounds(10, 10, 500, 500);
    frame.setTitle("グラフサンプル");
    frame.setVisible(true);
  }

  Test3_1(){
    JFreeChart chart =
      ChartFactory.createBarChart("月別売上",
                                  "月",
                                  "売上",
                                  createData(),
                                  PlotOrientation.VERTICAL,
                                  true,
                                  false,
                                  false);

    Plot plot = chart.getPlot();
    plot.setOutlinePaint(Color.PINK);

    ChartPanel cpanel = new ChartPanel(chart);
    getContentPane().add(cpanel, BorderLayout.CENTER);
  }

  private DefaultCategoryDataset createData(){
    DefaultCategoryDataset data = new DefaultCategoryDataset();
    String[] series = {"本社", "大阪支社", "名古屋支社"};
    String[] category = {"4月", "5月", "6月"};

    data.addValue(800, series[0], category[0]);
    data.addValue(600, series[0], category[1]);
    data.addValue(900, series[0], category[2]);
    data.addValue(500, series[1], category[0]);
    data.addValue(300, series[1], category[1]);
    data.addValue(200, series[1], category[2]);
    data.addValue(300, series[2], category[0]);
    data.addValue(900, series[2], category[1]);
    data.addValue(600, series[2], category[2]);

    return data;
  }
}
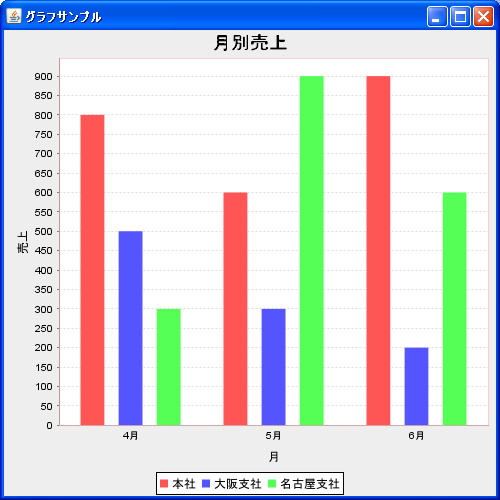
上記をコンパイルした後で実行すると次のようにJavaアプリケーションが起動します。
( Written by Tatsuo Ikura )