- Home ›
- JFreeChartを使ったグラフ作成 ›
- 描画領域の設定 ›
- HERE
Plotクラス
JFreeChartではタイトルや凡例の他に実際にグラフが表示されるグラフの描画領域があります。描画領域にはグラフそのものの他に軸などが含まれます。そして描画領域はPlotクラスのオブジェクトを使って表されます。
まずはPlotクラスについて確認します。Plotクラスのクラス図は次のようになっています。
- java.lang.Object
- org.jfree.chart.plot.Plot
- public abstract class Plot extends java.lang.Object implements AxisChangeListener, DatasetChangeListener, MarkerChangeListener, LegendItemSource, org.jfree.util.PublicCloneable, java.lang.Cloneable, java.io.Serializable
Plotクラスはabstractクラスですので直接オブジェクトを作成することは出来ません。Plotクラスを継承して独自のクラスを定義するか、既に用意されているabstractを使用します。
用意されているabstractは次の通りです。
CategoryPlot
CompassPlot
ContourPlot
DialPlot
FastScatterPlot
MeterPlot
MultiplePiePlot
PiePlot
PolarPlot
SpiderWebPlot
ThermometerPlot
WaferMapPlot
XYPlot
ファクトリメソッドを使って用意されたグラフを使用する場合、上記のいずれかのサブクラスを実際には使っています。使用するサブクラスによって独自のメソッドなどが用意されておりグラフ毎に描画領域に対して行える設定は異なりますが、次のページ以降では大元となるPlotクラスで用意されているメソッドの使い方について確認していきます。
Plotクラスのオブジェクトの取得
現在表示されているグラフの描画領域を表すPlotクラスのオブジェクトはJFreeChartクラスで用意されている「getPlot」メソッドを使って取得できます。
getPlot
public Plot getPlot()
Returns the plot for the chart. The plot is a class responsible for
coordinating the visual representation of the data, including the
axes (if any).

Returns:
  The plot.
メソッドを実行すると対象のグラフの描画領域を表すPlotクラスのオブジェクトを取得できます。
JFreeChart chart = ChartFactory.createPieChart(...);      /* 引数は省略 */

Plot plot = chart.getPlot();
取得したPlotクラスのオブジェクトに対して、Plotクラスで用意されている各種メソッドを使って設定を行っていきます。
サンプルプログラム
では簡単なサンプルを作成して試してみます。
import org.jfree.chart.JFreeChart;
import org.jfree.chart.ChartFactory;
import org.jfree.data.category.DefaultCategoryDataset;
import org.jfree.chart.plot.PlotOrientation;

import javax.swing.JFrame;
import java.awt.BorderLayout;
import org.jfree.chart.ChartPanel;

import org.jfree.chart.plot.Plot;
import java.awt.Color;

public class Test1_1 extends JFrame{
  public static void main(String[] args) {
    Test1_1 frame = new Test1_1();

    frame.setDefaultCloseOperation(JFrame.EXIT_ON_CLOSE);
    frame.setBounds(10, 10, 500, 500);
    frame.setTitle("グラフサンプル");
    frame.setVisible(true);
  }

  Test1_1(){
    JFreeChart chart =
      ChartFactory.createBarChart("月別売上",
                                  "月",
                                  "売上",
                                  createData(),
                                  PlotOrientation.VERTICAL,
                                  true,
                                  false,
                                  false);

    Plot plot = chart.getPlot();
    plot.setBackgroundPaint(new Color(255, 248, 220));

    ChartPanel cpanel = new ChartPanel(chart);
    getContentPane().add(cpanel, BorderLayout.CENTER);
  }

  private DefaultCategoryDataset createData(){
    DefaultCategoryDataset data = new DefaultCategoryDataset();
    String[] series = {"本社", "大阪支社", "名古屋支社"};
    String[] category = {"4月", "5月", "6月"};

    data.addValue(800, series[0], category[0]);
    data.addValue(600, series[0], category[1]);
    data.addValue(900, series[0], category[2]);
    data.addValue(500, series[1], category[0]);
    data.addValue(300, series[1], category[1]);
    data.addValue(200, series[1], category[2]);
    data.addValue(300, series[2], category[0]);
    data.addValue(900, series[2], category[1]);
    data.addValue(600, series[2], category[2]);

    return data;
  }
}
上記をコンパイルした後で実行すると次のようにJavaアプリケーションが起動します。
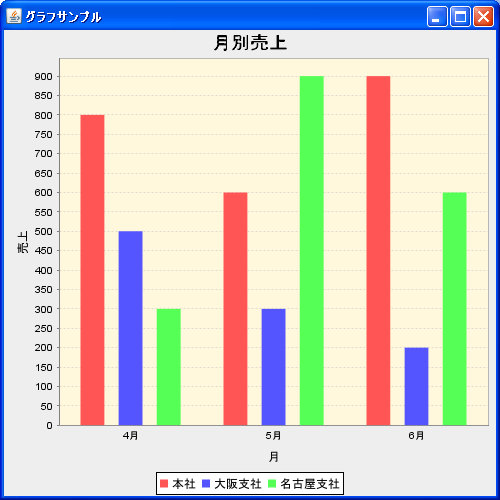
今回は背景の色を設定しました。では次のページから各設定方法を詳しく確認していきます。
( Written by Tatsuo Ikura )