- Home ›
- JFreeChartを使ったグラフ作成 ›
- 折れ線グラフ(LineChart, LineChat3D) ›
- HERE
3D折れ線グラフの作成(createLineChart3Dメソッド)
折れ線グラフでは線を立体にした3D折れ線グラフを作成することも可能です。
まずChartFactoryクラスの「createLineChart3D」メソッドを使って折れ線グラフを扱うJFreeChartクラスのオブジェクトを作成します。
createLineChart3D
public static JFreeChart createLineChart3D(java.lang.String title,
                                           java.lang.String categoryAxisLabel,
                                           java.lang.String valueAxisLabel,
                                           CategoryDataset dataset,
                                           PlotOrientation orientation,
                                           boolean legend,
                                           boolean tooltips,
                                           boolean urls)
Creates a line chart with default settings. The chart object returned
by this method uses a CategoryPlot instance as the plot, with a
CategoryAxis3D for the domain axis, a NumberAxis3D as the range axis,
and a LineRenderer3D as the renderer.

Parameters:
  title - the chart title (null permitted).
  categoryAxisLabel - the label for the category axis (null permitted).
  valueAxisLabel - the label for the value axis (null permitted).
  dataset - the dataset for the chart (null permitted).
  orientation - the chart orientation (horizontal or vertical) (null not permitted).
  legend - a flag specifying whether or not a legend is required.
  tooltips - configure chart to generate tool tips?
  urls - configure chart to generate URLs?
Returns:
  A line chart.
1番目の引数にグラフのタイトルを文字列で指定します。
2番目の引数には項目が配置される軸のラベルを文字列で指定します。3番目の引数には値が配置される軸のラベルを文字列で指定します。
4番目の引数にはグラフのデータをCategoryDatasetインターフェースを実装したクラスのオブジェクトで指定します。今回はDefaultCategoryDatasetクラスを使います。詳細は次のページで確認します。
5番目の引数にはo折れ線グラフの向きを指定します。指定可能な値はorg.jfree.chart.plot.PlotOrientationクラスで定義されており、次のどちらかとなります。
PlotOrientation.HORIZONTAL
PlotOrientation.VERTICAL
6番目の引数には凡例を表示するかどうかを「true」か「false」で指定します。
7番目の引数にはツールチップを作成するかどうかを「true」か「false」で指定します。
8番目の引数にはURLを作成するかどうかを「true」か「false」で指定します。
実際の使い方は次のようになります。
DefaultCategoryDataset data = new DefaultCategoryDataset();
JFreeChart chart = ChartFactory.createLineChart3S("輸入量",
                                                  "年度",
                                                  "トン(t)",
                                                  data,
                                                  PlotOrientation.VERTICAL,
                                                  true,
                                                  false,
                                                  false);
データの登録
データの登録は折れ線グラフの場合と同じくDefaultCategoryDatasetクラスを使用します。
| 米国 | 中国 | インド | |
|---|---|---|---|
| 2005年 | 300 | 200 | 100 |
| 2006年 | 500 | 600 | 150 |
| 2007年 | 400 | 200 | 700 |
実際には次のように記述します。
DefaultCategoryDataset data = new DefaultCategoryDataset();
String[] series = {"米国", "中国", "インド"};
String[] category = {"2005年", "2006年", "2007年"};

data.addValue(300, series[0], category[0]);
data.addValue(500, series[0], category[1]);
data.addValue(400, series[0], category[2]);
data.addValue(200, series[1], category[0]);
data.addValue(600, series[1], category[1]);
data.addValue(200, series[1], category[2]);
data.addValue(100, series[2], category[0]);
data.addValue(150, series[2], category[1]);
data.addValue(700, series[2], category[2]);
データの作成は折れ線グラフの場合と同じです。
サンプルプログラム
では簡単なサンプルを作成して試してみます。
import org.jfree.chart.JFreeChart;
import org.jfree.chart.ChartFactory;
import org.jfree.data.category.DefaultCategoryDataset;
import org.jfree.chart.plot.PlotOrientation;

import javax.swing.JFrame;
import java.awt.BorderLayout;
import org.jfree.chart.ChartPanel;

public class Test5_1 extends JFrame{
  public static void main(String[] args) {
    Test5_1 frame = new Test5_1();

    frame.setDefaultCloseOperation(JFrame.EXIT_ON_CLOSE);
    frame.setBounds(10, 10, 500, 500);
    frame.setTitle("グラフサンプル");
    frame.setVisible(true);
  }

  Test5_1(){
    DefaultCategoryDataset data = new DefaultCategoryDataset();
    String[] series = {"米国", "中国", "インド"};
    String[] category = {"2005年", "2006年", "2007年"};

    data.addValue(300, series[0], category[0]);
    data.addValue(500, series[0], category[1]);
    data.addValue(400, series[0], category[2]);
    data.addValue(200, series[1], category[0]);
    data.addValue(600, series[1], category[1]);
    data.addValue(200, series[1], category[2]);
    data.addValue(100, series[2], category[0]);
    data.addValue(150, series[2], category[1]);
    data.addValue(700, series[2], category[2]);

    JFreeChart chart =
      ChartFactory.createLineChart3D("輸入量",
                                     "年度",
                                     "トン(t)",
                                     data,
                                     PlotOrientation.VERTICAL,
                                     true,
                                     false,
                                     false);

    ChartPanel cpanel = new ChartPanel(chart);
    getContentPane().add(cpanel, BorderLayout.CENTER);
  }
}
上記をコンパイルした後で実行すると次のようにJavaアプリケーションが起動します。
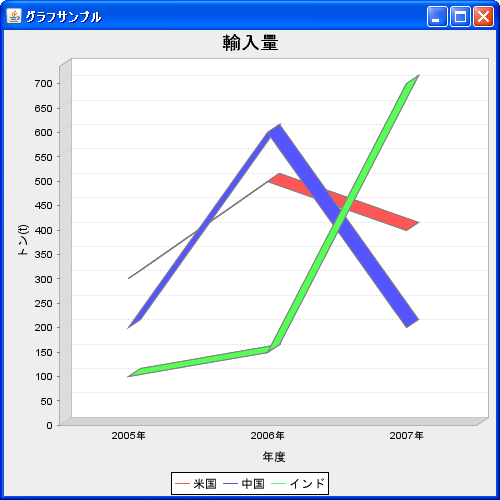
サンプルプログラム
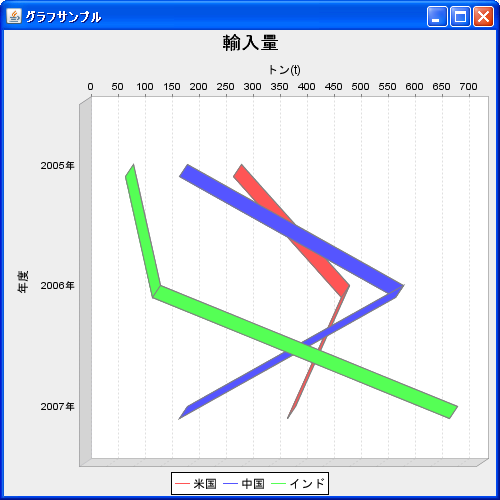
もう一つサンプルを試します。今度はグラフの向きを変えてみます。
import org.jfree.chart.JFreeChart;
import org.jfree.chart.ChartFactory;
import org.jfree.data.category.DefaultCategoryDataset;
import org.jfree.chart.plot.PlotOrientation;

import javax.swing.JFrame;
import java.awt.BorderLayout;
import org.jfree.chart.ChartPanel;

public class Test5_2 extends JFrame{
  public static void main(String[] args) {
    Test5_2 frame = new Test5_2();

    frame.setDefaultCloseOperation(JFrame.EXIT_ON_CLOSE);
    frame.setBounds(10, 10, 500, 500);
    frame.setTitle("グラフサンプル");
    frame.setVisible(true);
  }

  Test5_2(){
    DefaultCategoryDataset data = new DefaultCategoryDataset();
    String[] series = {"米国", "中国", "インド"};
    String[] category = {"2005年", "2006年", "2007年"};

    data.addValue(300, series[0], category[0]);
    data.addValue(500, series[0], category[1]);
    data.addValue(400, series[0], category[2]);
    data.addValue(200, series[1], category[0]);
    data.addValue(600, series[1], category[1]);
    data.addValue(200, series[1], category[2]);
    data.addValue(100, series[2], category[0]);
    data.addValue(150, series[2], category[1]);
    data.addValue(700, series[2], category[2]);

    JFreeChart chart =
      ChartFactory.createLineChart3D("輸入量",
                                     "年度",
                                     "トン(t)",
                                     data,
                                     PlotOrientation.HORIZONTAL,
                                     true,
                                     false,
                                     false);

    ChartPanel cpanel = new ChartPanel(chart);
    getContentPane().add(cpanel, BorderLayout.CENTER);
  }
}
上記をコンパイルした後で実行すると次のようにJavaアプリケーションが起動します。
( Written by Tatsuo Ikura )