- Home ›
- JFreeChartを使ったグラフ作成 ›
- バブルチャート(BubbleChart) ›
- HERE
グラフの向きを変更
広告
バブルチャートではX軸とY軸の表示する位置を入れ替えて表示することが可能です。
「createBubbleChart」メソッドを使ってオブジェクトを作成する時の5番目の引数で指定します。指定できる値は次のいずれかです。
PlotOrientation.VERTICAL
PlotOrientation.HORIZONTAL
PlotOrientation.VERTICALとPlotOrientation.HORIZONTALを指定した場合ではX軸とY軸の位置関係が入れ替わるだけです。
実際には次のように記述します。
MatrixSeriesCollection data = new MatrixSeriesCollection();
JFreeChart chart = ChartFactory.createBubbleChart("収益分析",
                                                 "ページ数",
                                                 "更新頻度",
                                                 data,
                                                 PlotOrientation.HORIZONTAL,
                                                 true,
                                                 false,
                                                 false);
サンプルプログラム
では簡単なサンプルを作成して試してみます。
import org.jfree.chart.JFreeChart;
import org.jfree.chart.ChartFactory;
import org.jfree.data.xy.MatrixSeriesCollection;
import org.jfree.data.xy.MatrixSeries;
import org.jfree.chart.plot.PlotOrientation;
import javax.swing.JFrame;
import java.awt.BorderLayout;
import org.jfree.chart.ChartPanel;
public class Test4_1 extends JFrame{
public static void main(String[] args) {
Test4_1 frame = new Test4_1();
frame.setDefaultCloseOperation(JFrame.EXIT_ON_CLOSE);
frame.setBounds(10, 10, 500, 500);
frame.setTitle("グラフサンプル");
frame.setVisible(true);
}
Test4_1(){
MatrixSeriesCollection data = new MatrixSeriesCollection();
JFreeChart chart = ChartFactory.createBubbleChart("収益分析",
"ページ数",
"更新頻度",
createData(),
PlotOrientation.HORIZONTAL,
true,
false,
false);
ChartPanel cpanel = new ChartPanel(chart);
getContentPane().add(cpanel, BorderLayout.CENTER);
}
private MatrixSeriesCollection createData(){
MatrixSeriesCollection data = new MatrixSeriesCollection();
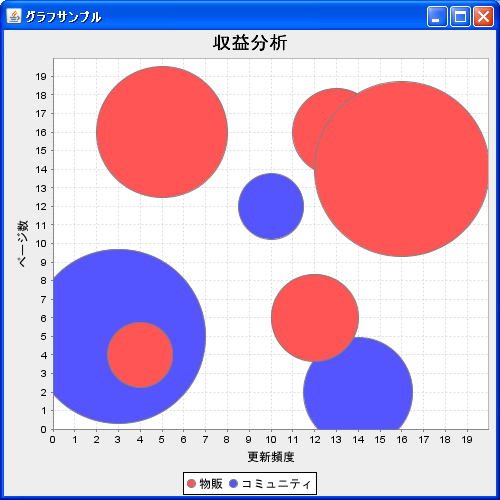
MatrixSeries series1 = new MatrixSeries("物販", 20, 20);
series1.update(16, 14, 8d);
series1.update(13, 16, 4d);
series1.update(4, 4, 3d);
series1.update(5, 16, 6d);
series1.update(12, 6, 4d);
MatrixSeries series2 = new MatrixSeries("コミュニティ", 20, 20);
series2.update(3, 5, 8d);
series2.update(14, 2, 5d);
series2.update(10, 12, 3d);
data.addSeries(series1);
data.addSeries(series2);
return data;
}
}
上記をコンパイルした後で実行すると次のようにJavaアプリケーションが起動します。
( Written by Tatsuo Ikura )