- Home ›
- JFreeChartを使ったグラフ作成 ›
- バブルチャート(BubbleChart) ›
- HERE
複数の系列のデータ
広告
バブルチャートの場合は複数の系列のデータを取り扱う事が可能です。
ここでは例として次のようなデータを元にグラフを作成します。
系列:物販
| 行(更新頻度) | 列(ページ数) | 値 |
|---|---|---|
| 16 | 14 | 8 |
| 13 | 16 | 4 |
| 4 | 4 | 3 |
| 5 | 16 | 6 |
| 12 | 6 | 4 |
系列:コミュニティ
| 行(更新頻度) | 列(ページ数) | 値 |
|---|---|---|
| 3 | 5 | 8 |
| 14 | 2 | 5 |
| 10 | 12 | 3 |
系列を表すMatrixSeriesクラスのオブジェクトを作成し、それぞれの系列にデータを登録していきます。
MatrixSeriesクラスのコンストラクタでは行と列の数を指定します。複数の系列を使用する時にそれぞれの系列で行と列の値が異なる場合は、全ての系列の中で最大の行数と最大の列数が使用されます。
実際には次のように記述します。
MatrixSeriesCollection data = new MatrixSeriesCollection();

MatrixSeries series1 = new MatrixSeries("物販", 20, 20);
series1.update(16, 14, 8d);
series1.update(13, 16, 4d);
series1.update(4, 4, 3d);
series1.update(5, 16, 6d);
series1.update(12, 6, 4d);

MatrixSeries series2 = new MatrixSeries("コミュニティ", 20, 20);
series2.update(3, 5, 8d);
series2.update(14, 2, 5d);
series2.update(10, 12, 3d);

data.addSeries(series1);
data.addSeries(series2);
サンプルプログラム
では簡単なサンプルを作成して試してみます。
import org.jfree.chart.JFreeChart;
import org.jfree.chart.ChartFactory;
import org.jfree.data.xy.MatrixSeriesCollection;
import org.jfree.data.xy.MatrixSeries;
import org.jfree.chart.plot.PlotOrientation;

import javax.swing.JFrame;
import java.awt.BorderLayout;
import org.jfree.chart.ChartPanel;

public class Test3_1 extends JFrame{
  public static void main(String[] args) {
    Test3_1 frame = new Test3_1();

    frame.setDefaultCloseOperation(JFrame.EXIT_ON_CLOSE);
    frame.setBounds(10, 10, 500, 500);
    frame.setTitle("グラフサンプル");
    frame.setVisible(true);
  }

  Test3_1(){
    MatrixSeriesCollection data = new MatrixSeriesCollection();
    JFreeChart chart = ChartFactory.createBubbleChart("収益分析",
                                                 "ページ数",
                                                 "更新頻度",
                                                 createData(),
                                                 PlotOrientation.VERTICAL,
                                                 true,
                                                 false,
                                                 false);

    ChartPanel cpanel = new ChartPanel(chart);
    getContentPane().add(cpanel, BorderLayout.CENTER);
  }

  private MatrixSeriesCollection createData(){
    MatrixSeriesCollection data = new MatrixSeriesCollection();

    MatrixSeries series1 = new MatrixSeries("物販", 20, 20);
    series1.update(16, 14, 8d);
    series1.update(13, 16, 4d);
    series1.update(4, 4, 3d);
    series1.update(5, 16, 6d);
    series1.update(12, 6, 4d);

    MatrixSeries series2 = new MatrixSeries("コミュニティ", 20, 20);
    series2.update(3, 5, 8d);
    series2.update(14, 2, 5d);
    series2.update(10, 12, 3d);

    data.addSeries(series1);
    data.addSeries(series2);

    return data;
  }
}
上記をコンパイルした後で実行すると次のようにJavaアプリケーションが起動します。
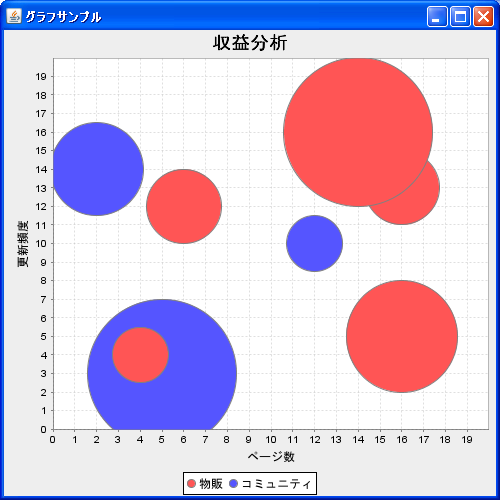
( Written by Tatsuo Ikura )