- Home ›
- JFreeChartを使ったグラフ作成 ›
- バブルチャート(BubbleChart) ›
- HERE
バブルチャートのデータ(MatrixSeriesCollectionクラス)
バブルチャートでは系列を作成し個々のデータを系列に登録していきます。そして全ての系列を系列コレクションに追加します。
まずは系列コレクションを表すMatrixSeriesCollectionクラスのオブジェクトを作成します。
MatrixSeriesCollectionクラスのクラス図は次のようになっています。
- java.lang.Object
- org.jfree.data.general.AbstractDataset
- org.jfree.data.general.AbstractSeriesDataset
- org.jfree.data.xy.AbstractXYDataset
- org.jfree.data.xy.AbstractXYZDataset
- org.jfree.data.xy.MatrixSeriesCollection
- public class MatrixSeriesCollection extends AbstractXYZDataset implements XYZDataset, org.jfree.util.PublicCloneable, java.io.Serializable
コンストラクタは2つ用意されています。デフォルトのコンストラクタは次のようになっています。
MatrixSeriesCollection
public MatrixSeriesCollection()
Constructs an empty dataset.
次のようにオブジェクトを作成します。
MatrixSeriesCollection data = new MatrixSeriesCollection();
これで系列を管理するオブジェクトが作成できました。次に系列を作成します。
系列の登録
系列はMatrixSeriesクラスを使います。クラス図は次のようになっています。
- java.lang.Object
- org.jfree.data.general.Series
- org.jfree.data.xy.MatrixSeries
- public class MatrixSeries extends Series implements java.io.Serializable
MatrixSeriesクラスのコンストラクタは1つ用意されています。
MatrixSeries
public MatrixSeries(java.lang.String name,
                    int rows,
                    int columns)
Constructs a new matrix series.

By default, all matrix items are initialzed to 0.

Parameters:
  name - series name (null not permitted).
  rows - the number of rows.
  columns - the number of columns.
1番目の引数に系列の名前を指定します。バブルチャートでは全体を行と列で格子状の領域として扱います。2番目の引数で領域の行数を指定し、3番目の引数で領域の列数を指定します。バブルチャートでは行がY軸、列がX軸に該当します。
MatrixSeriesクラスのオブジェクトを作成したら、MatrixSeriesCollectionクラスで用意されている「addSeries」メソッドを使って系列を追加していきます。
addSeries
public void addSeries(MatrixSeries series)
Adds a series to the collection.

Notifies all registered listeners that the dataset has changed.

Parameters:
  series - the series.
Throws:
  java.lang.IllegalArgumentException
実際には次のように記述します。
MatrixSeriesCollection data = new MatrixSeriesCollection();

MatrixSeries series = new MatrixSeries("物販", 20, 20);
data.addSeries(series);
これで系列が出来ました。最後に系列に個々のデータを登録していきます。
データの登録
最後に系列に対してデータを登録していきます。MatrixSeriesクラスで用意されている「update」メソッドを使います。
update
public void update(int i,
                   int j,
                   double mij)
Updates the value of the specified item in this matrix series.

Parameters:
  i - the row of the item.
  j - the column of the item.
  mij - the new value for the item.
1番目と2番目の引数で値を設定したい行と列を指定し、3番目の引数で値の大きさを設定します。値の大きさはグラフ上を行列の領域として見たときの直径となります。10×10の領域とした場合には値に10dを指定すると領域全体を埋め尽くす大きな円が描かれます(中心が領域の中心の場合)。
実際には次のように記述します。
MatrixSeriesCollection data = new MatrixSeriesCollection();

MatrixSeries series = new MatrixSeries("物販", 20, 20);
series.update(5, 7, 10d);
series.update(10, 3, 3d);

data.addSeries(series);
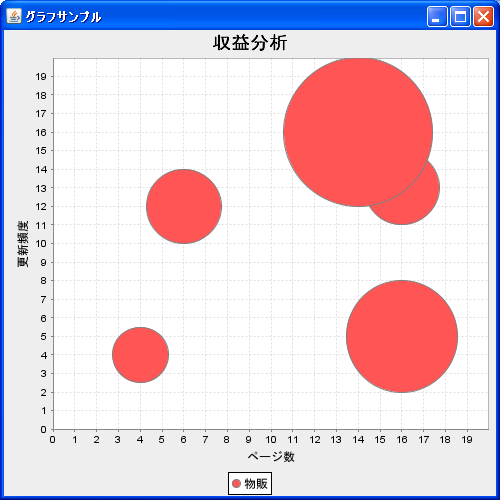
では実際のデータを使って登録してみます。今回は次のようなデータを使用します。
| 行(更新頻度) | 列(ページ数) | 値 |
|---|---|---|
| 16 | 14 | 8 |
| 13 | 16 | 4 |
| 4 | 4 | 3 |
| 5 | 16 | 6 |
| 12 | 6 | 4 |
実際には次のように記述します。
MatrixSeriesCollection data = new MatrixSeriesCollection();

MatrixSeries series = new MatrixSeries("物販", 20, 20);
series.update(16, 14, 8d);
series.update(13, 16, 4d);
series.update(4, 4, 3d);
series.update(5, 16, 6d);
series.update(12, 6, 4d);

data.addSeries(series);
サンプルプログラム
では簡単なサンプルを作成して試してみます。
import org.jfree.chart.JFreeChart;
import org.jfree.chart.ChartFactory;
import org.jfree.data.xy.MatrixSeriesCollection;
import org.jfree.data.xy.MatrixSeries;
import org.jfree.chart.plot.PlotOrientation;

import javax.swing.JFrame;
import java.awt.BorderLayout;
import org.jfree.chart.ChartPanel;

public class Test2_1 extends JFrame{
  public static void main(String[] args) {
    Test2_1 frame = new Test2_1();

    frame.setDefaultCloseOperation(JFrame.EXIT_ON_CLOSE);
    frame.setBounds(10, 10, 500, 500);
    frame.setTitle("グラフサンプル");
    frame.setVisible(true);
  }

  Test2_1(){
    MatrixSeriesCollection data = new MatrixSeriesCollection();
    JFreeChart chart = ChartFactory.createBubbleChart("収益分析",
                                                 "ページ数",
                                                 "更新頻度",
                                                 createData(),
                                                 PlotOrientation.VERTICAL,
                                                 true,
                                                 false,
                                                 false);

    ChartPanel cpanel = new ChartPanel(chart);
    getContentPane().add(cpanel, BorderLayout.CENTER);
  }

  private MatrixSeriesCollection createData(){
    MatrixSeriesCollection data = new MatrixSeriesCollection();

    MatrixSeries series = new MatrixSeries("物販", 20, 20);
    series.update(16, 14, 8d);
    series.update(13, 16, 4d);
    series.update(4, 4, 3d);
    series.update(5, 16, 6d);
    series.update(12, 6, 4d);

    data.addSeries(series);

    return data;
  }
}
上記をコンパイルした後で実行すると次のようにJavaアプリケーションが起動します。
( Written by Tatsuo Ikura )