- Home ›
- JFreeChartを使ったグラフ作成 ›
- 棒グラフ(BarChart, BarChart3D) ›
- HERE
棒グラフの描画領域(CategoryPlotクラス)
グラフの描画領域を取得し、描画領域に対する設定を行っていきます。ファクトリメソッドを使ってJFreeChartクラスのオブジェクトを作成した場合は、JFreeChartクラスで用意されている「getPlot」メソッドを使ってPlotクラスのオブジェクトを取得します。
getPlot
public Plot getPlot()
Returns the plot for the chart. The plot is a class responsible for
coordinating the visual representation of the data, including the
axes (if any).

Returns:
  The plot.
棒グラフの場合には、取得したPlotクラスのオブジェクトを、PlotクラスのサブクラスであるCategoryPlotクラスにキャストして取得して使います。例えば次のように記述します。
JFreeChart chart = ChartFactory.createBarChart(...);      /* 引数は省略 */

CategoryPlot plot = (CategoryPlot)chart.getPlot();
またCategoryPlotクラスのオブジェクトを取得する場合には「getPlot」メソッドの代わりに「getCategoryPlot」メソッドを使って直接CategoryPlotクラスのオブジェクトを取得することも可能です。
getCategoryPlot
public CategoryPlot getCategoryPlot()
Returns the plot cast as a CategoryPlot.

NOTE: if the plot is not an instance of CategoryPlot, then a
ClassCastException is thrown.

Returns:
  The plot.
例えば次のように記述します。
JFreeChart chart = ChartFactory.createBarChart(...);      /* 引数は省略 */

CategoryPlot plot = chart.getCategoryPlot();
ではCategoryPlotクラスについて確認します。
CategoryPlotクラス
CategoryPlotクラスのクラス図は次のようになっています。
- java.lang.Object
- org.jfree.chart.plot.Plot
- org.jfree.chart.plot.CategoryPlot
- public class CategoryPlot extends Plot implements ValueAxisPlot, Zoomable, RendererChangeListener, java.lang.Cloneable, org.jfree.util.PublicCloneable, java.io.Serializable
用意されているコンストラクタは次の2つです。
| コンストラクタ |
|---|
| CategoryPlot() Default constructor. |
| CategoryPlot(CategoryDataset dataset, CategoryAxis domainAxis, ValueAxis rangeAxis, CategoryItemRenderer renderer) Creates a new plot. |
今回はコンストラクタでオブジェクトを直接生成するのではなく、JFreeChartクラスの「getPlot」メソッドでオブジェクトを取得します。
取得したCategoryPlotクラスのオブジェクトは棒グラフの描画領域を表すオブジェクトです。CategoryPlotクラスで定義されているメソッドや、親クラスのPlotクラスで用意されているメソッドを使用して描画領域に対する設定を行うことが可能です。
サンプルプログラム
では簡単なサンプルを作成して試してみます。
import org.jfree.chart.JFreeChart;
import org.jfree.chart.ChartFactory;
import org.jfree.data.category.DefaultCategoryDataset;
import org.jfree.chart.plot.PlotOrientation;

import javax.swing.JFrame;
import java.awt.BorderLayout;
import org.jfree.chart.ChartPanel;

import org.jfree.chart.plot.CategoryPlot;
import java.awt.Color;

public class Test6_1 extends JFrame{
  public static void main(String[] args) {
    Test6_1 frame = new Test6_1();

    frame.setDefaultCloseOperation(JFrame.EXIT_ON_CLOSE);
    frame.setBounds(10, 10, 500, 500);
    frame.setTitle("グラフサンプル");
    frame.setVisible(true);
  }

  Test6_1(){
    JFreeChart chart =
      ChartFactory.createBarChart("月別売上",
                                  "月",
                                  "売上",
                                  createData(),
                                  PlotOrientation.VERTICAL,
                                  true,
                                  false,
                                  false);

    CategoryPlot plot = chart.getCategoryPlot();
    plot.setBackgroundPaint(Color.ORANGE);

    ChartPanel cpanel = new ChartPanel(chart);
    getContentPane().add(cpanel, BorderLayout.CENTER);
  }

  private DefaultCategoryDataset createData(){
    DefaultCategoryDataset data = new DefaultCategoryDataset();
    String[] series = {"本社", "大阪支社", "名古屋支社"};
    String[] category = {"4月", "5月", "6月"};

    data.addValue(800, series[0], category[0]);
    data.addValue(600, series[0], category[1]);
    data.addValue(900, series[0], category[2]);
    data.addValue(500, series[1], category[0]);
    data.addValue(300, series[1], category[1]);
    data.addValue(200, series[1], category[2]);
    data.addValue(300, series[2], category[0]);
    data.addValue(900, series[2], category[1]);
    data.addValue(600, series[2], category[2]);

    return data;
  }
}
上記をコンパイルした後で実行すると次のようにJavaアプリケーションが起動します。
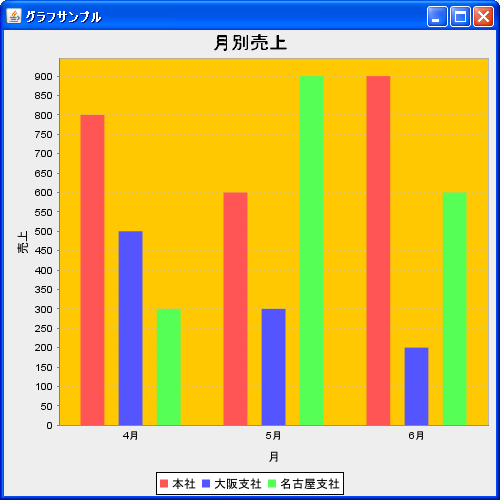
今回は例として描画領域の背景色をオレンジに変更しました。また上記のオレンジの箇所がグラフの描画領域となります。
( Written by Tatsuo Ikura )