- Home ›
- JFreeChartを使ったグラフ作成 ›
- 棒グラフ(BarChart, BarChart3D) ›
- HERE
棒グラフの作成(createBarChartメソッド)
棒グラフの基本的な作成方法を確認します。
まずChartFactoryクラスの「createBarChart」メソッドを使って棒グラフを扱うJFreeChartクラスのオブジェクトを作成します。
createBarChart
public static JFreeChart createBarChart(java.lang.String title,
                                        java.lang.String categoryAxisLabel,
                                        java.lang.String valueAxisLabel,
                                        CategoryDataset dataset,
                                        PlotOrientation orientation,
                                        boolean legend,
                                        boolean tooltips,
                                        boolean urls)
Creates a bar chart. The chart object returned by this method uses a
CategoryPlot instance as the plot, with a CategoryAxis for the domain
axis, a NumberAxis as the range axis, and a BarRenderer as the renderer.

Parameters:
  title - the chart title (null permitted).
  categoryAxisLabel - the label for the category axis (null permitted).
  valueAxisLabel - the label for the value axis (null permitted).
  dataset - the dataset for the chart (null permitted).
  orientation - the plot orientation (horizontal or vertical) (null not
    permitted).
  legend - a flag specifying whether or not a legend is required.
  tooltips - configure chart to generate tool tips?
  urls - configure chart to generate URLs?
Returns:
  A bar chart.
1番目の引数にグラフのタイトルを文字列で指定します。
2番目の引数には項目が配置される軸のラベルを文字列で指定します。3番目の引数には値が配置される軸のラベルを文字列で指定します。
4番目の引数にはグラフのデータをCategoryDatasetインターフェースを実装したクラスのオブジェクトで指定します。今回はDefaultCategoryDatasetクラスを使います。詳細は次のページで確認します。
5番目の引数には棒グラフの向きを指定します。指定可能な値はorg.jfree.chart.plot.PlotOrientationクラスで定義されており、次のどちらかとなります。
PlotOrientation.VERTICAL    値を表す軸がY軸
PlotOrientation.HORIZONTAL  値を表す軸がX軸
6番目の引数には凡例を表示するかどうかを「true」か「false」で指定します。
7番目の引数にはツールチップを作成するかどうかを「true」か「false」で指定します。
8番目の引数にはURLを作成するかどうかを「true」か「false」で指定します。
実際の使い方は次のようになります。
DefaultCategoryDataset data = new DefaultCategoryDataset();
JFreeChart chart = ChartFactory.createBarChart("月別売上",
                                               "月",
                                               "売上",
                                               data,
                                               PlotOrientation.VERTICAL,
                                               true,
                                               false,
                                               false);
実際のデータの追加方法は次のページで確認します。
サンプルプログラム
では簡単なサンプルを作成して試してみます。
import org.jfree.chart.JFreeChart;
import org.jfree.chart.ChartFactory;
import org.jfree.data.category.DefaultCategoryDataset;
import org.jfree.chart.plot.PlotOrientation;

import javax.swing.JFrame;
import java.awt.BorderLayout;
import org.jfree.chart.ChartPanel;

public class Test1_1 extends JFrame{
  public static void main(String[] args) {
    Test1_1 frame = new Test1_1();

    frame.setDefaultCloseOperation(JFrame.EXIT_ON_CLOSE);
    frame.setBounds(10, 10, 500, 500);
    frame.setTitle("グラフサンプル");
    frame.setVisible(true);
  }

  Test1_1(){
    DefaultCategoryDataset data = new DefaultCategoryDataset();
    JFreeChart chart =
      ChartFactory.createBarChart("月別売上",
                                  "月",
                                  "売上",
                                  data,
                                  PlotOrientation.VERTICAL,
                                  true,
                                  false,
                                  false);

    ChartPanel cpanel = new ChartPanel(chart);
    getContentPane().add(cpanel, BorderLayout.CENTER);
  }
}
上記をコンパイルした後で実行すると次のようにJavaアプリケーションが起動します。
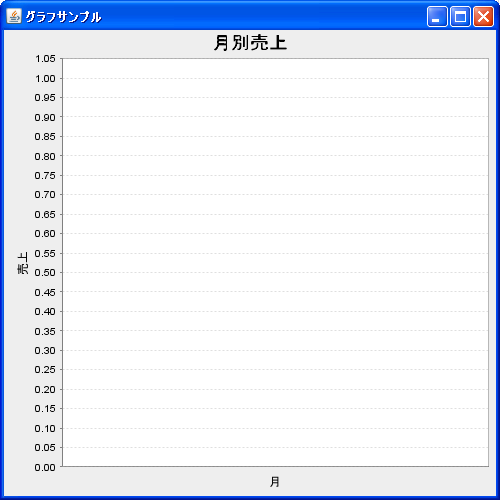
現状ではグラフのデータが含まれていませんので凡例なども表示されていません。
( Written by Tatsuo Ikura )